
If you don’t know where you are going, any road will get you there.
-Lewis Carroll
Lead, Contact or Account assignment by geography relies on standardized location values.
CA
CAL
Cali
Calif.
California
Califoria
As you can see in some of the examples below, the Data Laundry is actually capable of:
• Correcting the vast variation of State and Country values
• Identifying Country and State (where missing) from phone, location, email etc.
• Format Phone numbers
• Decode the Job Title into usable Job Role and Job Function picklists
• Correct misspellings etc.
| Before | After | ||
| State | Country | State | Country |
| ZA | South Africa | ||
| US | United States | ||
| USA | United States | ||
| U.S. | United States | ||
| SE | Sweden | ||
| Croatia/Hrvatska | Croatia | ||
| iNingizimu Afrika | South Africa | ||
| SA | Saudi Arabia | ||
| England | United kingdom | ||
| GA | GA | United States | |
| CO | CO | United States | |
| VIC | VIC | Australia | |
| UGANDA | Uganda | ||
| United Kingdom | United kingdom | ||
| OK | OK | United States | |
| FL | FL | United States | |
| ACT | ACT | Australia |
| Original | After | ||
| Phone | State | Country | |
| +39 (236) 256 5555 | Italy | ||
| +33 (0)1 25 56 98 11 | France | ||
| therese.taylor@datatrimtest.de | Germany | ||
| thormod.taylor@datatrim.test.no | Norway | ||
| emanule.jones@datatrim.test.fr | France | ||
| giani.johnson@datatrim.test.it | Italy | ||
| (831) 222-5001 | TX | United States | |
| (209) 555-0031 | CA | United States |
| Original | After | |
| Title | Job Role | Job Function |
| Assistant Director Accounts Payable | Director | Accounts Payable |
| Controller | Manager | Finance |
| Supply Chain Consultant | Specialist | Operations |
| Finance Programme Lead – Data and Systems | Manager | Finance |
| Chief Information Officer | CIO | IT |
| Assistant | Assistant | |
| Manager Warehouse & Procurment | Manager | Procurement |
| Directeur Informatique | Director | IT |
| Senior Director, BPO Vendor Management | Director | Procurement |
| Business owners | CEO | |
| Chief Executive Officer & Chairman of the Board | CEO | |
| VP of Marketing & Communications | Vice President | Marketing |
In this article we will walk you through the steps to successfully Assess your current Data Quality, Improve the Data Quality and put a process in place so that you can keep the higher Data Quality level on an ongoing basis.
To get a better understanding on how we define Data Quality have a look at this article: Understanding Data Quality
Getting Started with Your Data Quality Assessment
To get started with your Data Quality Assessment, simply Install the App from the AppExchange, and let us have a look at the basics.
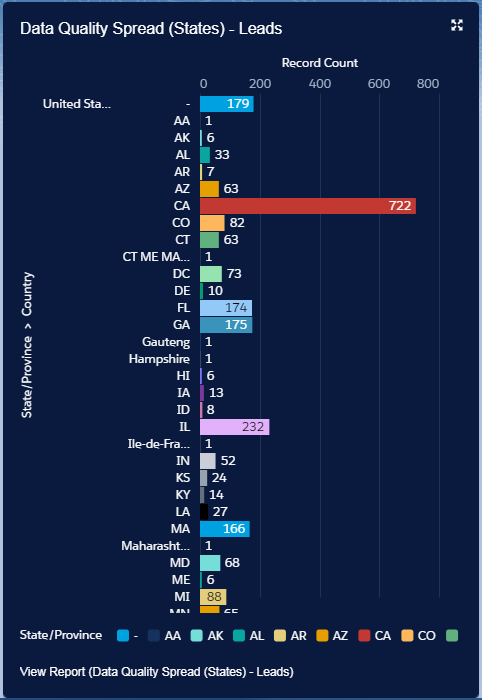
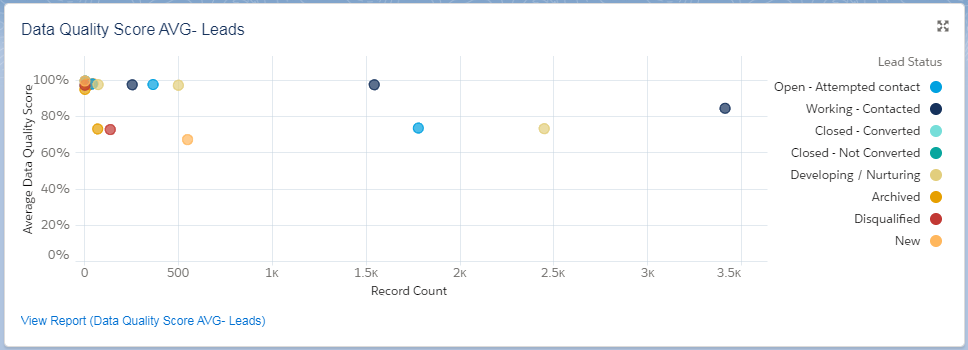
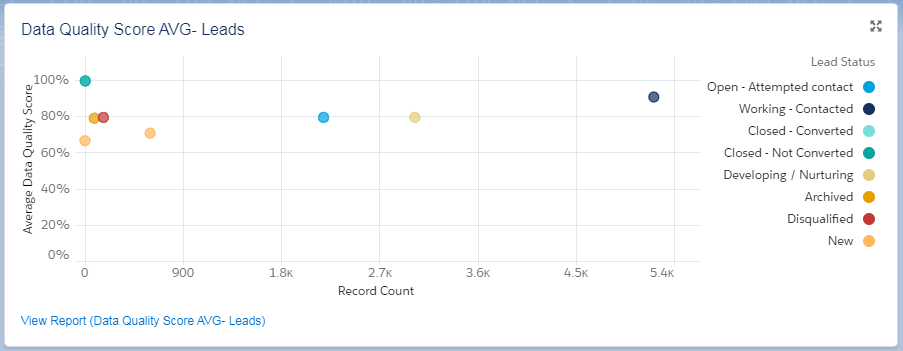 Image: Dashboard: High Level Data Quality – Lead
We note that this dashboard element for Leads, illustrates the immediate Data Quality Score for Leads based on Lead Status and the Spread of the Data Quality Score across ALL leads.
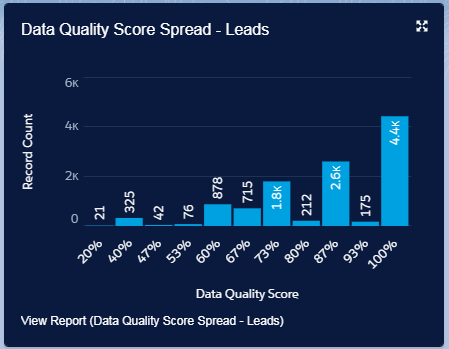
The Average score, is a good single number reference, but it doesn’t provide details on the spread.
When we look at the spread, we see that a nice portion of our data is actually pretty good, and we probably shouldn’t worry too much about these. The spread helps us to focus our efforts where it is most needed.
The Average Score and the Spread are good starting points, and you should keep these numbers in mind as they will represent your “before” status, and will be a reference for the improvements which you will be making.
The Data Quality Scoring is based on a number of different business-critical fields. You can read more about how you can assess the Data Quality in this article Assessing the Data Quality.
Before we go further, with your Data Quality Assessment, you might want to have a look at how this score is calculated, and adopt it to your business-critical fields. See the Appendix in user guide with the Data Quality score being described.
Getting down to earth
Once the helicopter view above is established it is time to dig into the details, and we know that the devil is in the detail, so let’s look at some examples.
Cleaning Data in DataTrim is based on validation, standardization and normalization based on a range of reference data. Each country around the world has different formats, standards etc. so in order to make sure that the appropriate reference data is being used it is pivotal that we know which country we are dealing with.
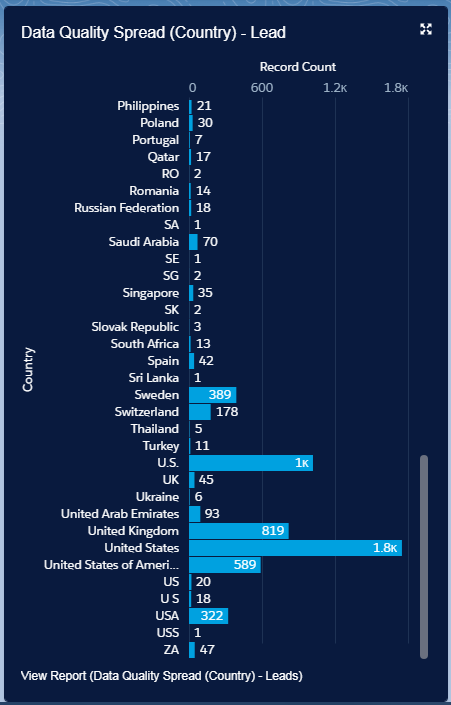
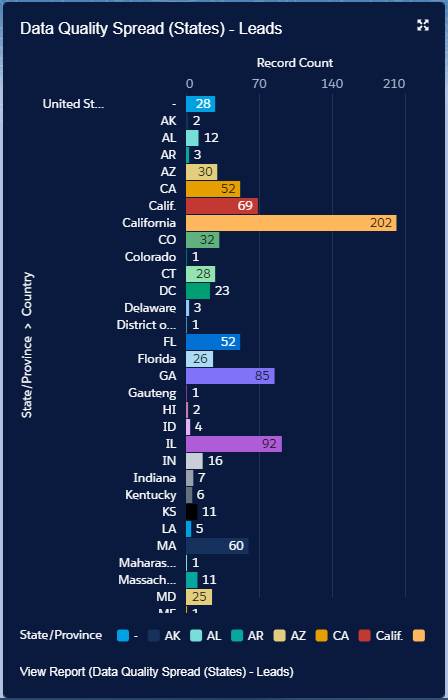
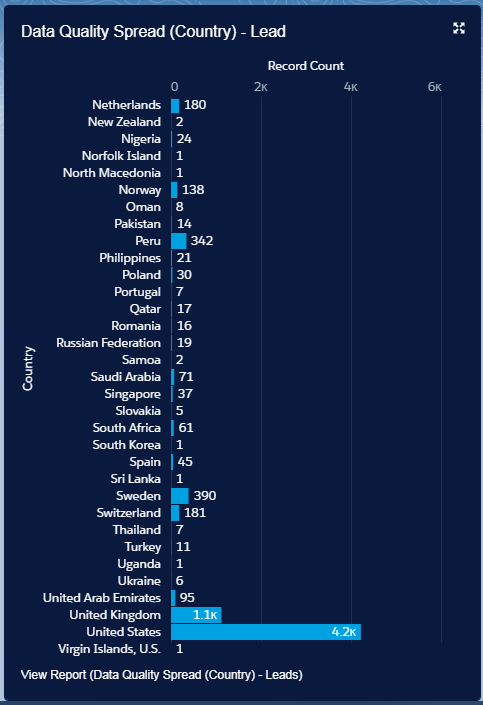
Where in the world is this coming from?
|
|
This is not an unusual result when looking into any database, even though you may have picklists in place, forms which users’ needs to use for entering the data etc. there will always be variances.
Fortunately, the DataTrim Data Laundry will be able to fix this for you automatically, due to the built-in reference data and algorithms.
Some records don’t have a Country or State and so these are already giving us a big hint at why the Data Quality is so bad. But don’t panic just yet, the DataTrim Data Laundry will be able to identify the country and state from information kept in other fields.
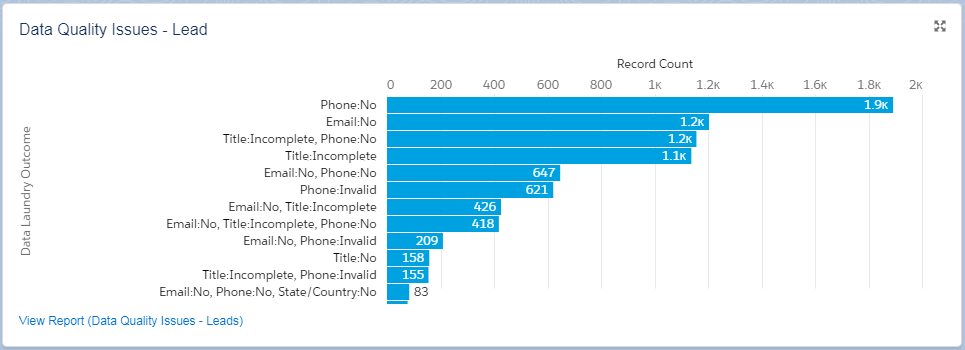
Other issues
In addition to cleaning up the records using the reference data and built-in algorithms, the Data Laundry will classify each record into 3 classes: OK, Cleaned, Still Dirty, and for the Dirty Records an outcome code will be generated to highlight what is wrong with each individual record.
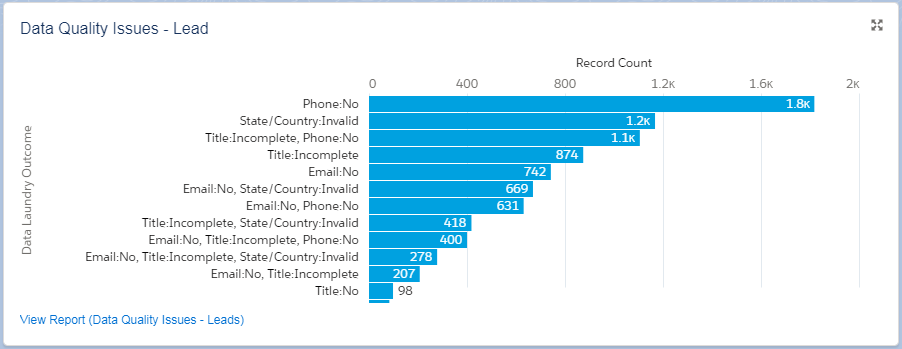
OBS: These reports will initially be empty as nothing has yet been cleaned and validated.
This report already gives us another good hint at what we should be doing to get the Data Quality Score up.
But it is still just numbers in a report, and a Data Quality Assessment reference for what the current status is. Let’s now start looking at the data.
Improving your Data Quality
Start by creating a Data Laundry Basket, Select Action: Preview.
| On the Selection Tab, you may want to create a filter, to focus on a particular set of records (records from an acquisition, from the last 18 months, etc.), or simply clean out the predefined filters to get ALL records from your object (Lead, Contact or Account). |
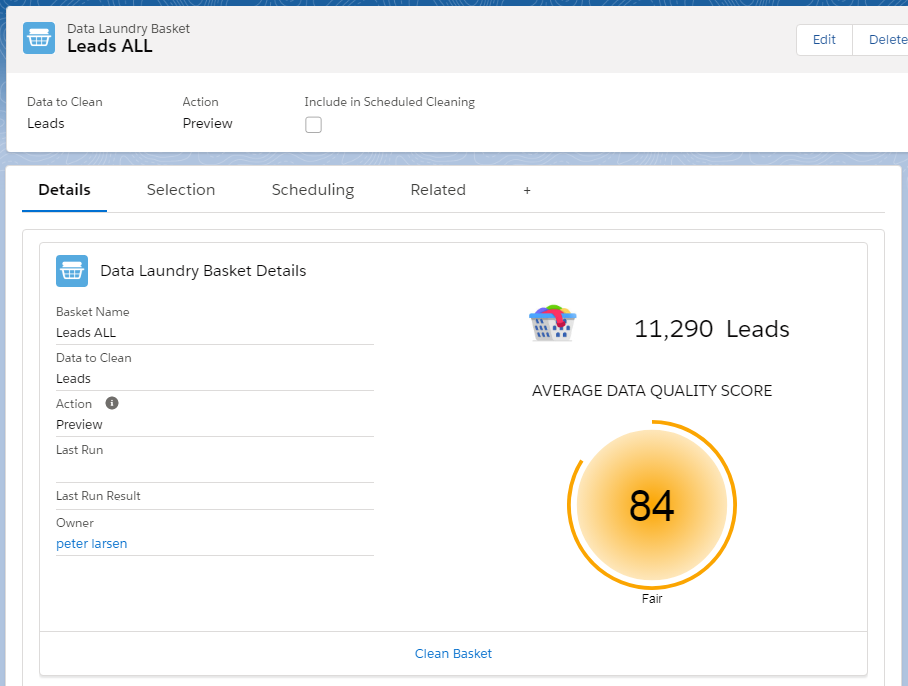 Image: Laundry Basket Details |
We will not yet clean this basket, but process it in Preview Mode.
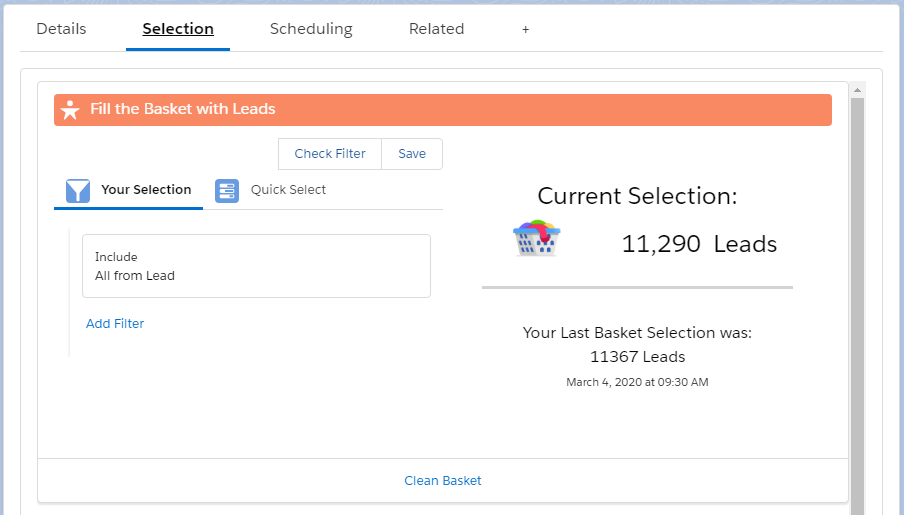 Image: Laundry Basket Selection |
The Preview Mode will NOT update our records, but generate a csv file which we will analyze to validate the proposed outcome before we actually start cleaning the data./td> |
Click the Clean Basket link, to go to the Washer, Load and Start the Washer to process the data.
Once completed you will get a Data Laundry Result, indicating how many records was cleaned, and how many records that still need some scrubbing.

Surprise !!!! – It is not all that perfect ?
Although the Data Laundry is capable of standardizing and normalizing your existing data, it doesn’t fill in missing phone numbers, emails and titles + yes its too bad, we know ?.
In addition to the corrections, the Data Quality Assessment functionlaity will highlight your data quality issues, and outline what is wrong.
Some records are thus flagged as DIRTY, mainly due to the fact that data simply is missing business-critical information. These records are the ones which will never receive your emails, receive your phone calls etc. They just sit there filling up without adding much value.
These records may be important, and so with little effort you might be able to correct these manually and thus improve the data quality.
You may 1) put a process in place to enrich the records with the missing information and 2) use the Data Quality indicators to motivate your team to collect and enrich as the leads/contacts are being engaged.
If these records over time is not enriched, you may consider archiving them, to avoid wasting time and money on them.
Finally, there is the records with INVALID data, these requires a closer look.
Some of the invalid data can be corrected manually, but there may also be really BAD data in between. Data which you also should consider archiving, or at least flag as records to be excluded from your business processes.
| Status | City | Postalcode | State | Country | Outcome |
| Dirty | Petah Tikva | 4951033 | Israel | Invalid Postalcode | |
| Dirty | Lyngby | 2800 KGS. | Denmark | Invalid Postalcode | |
| Dirty | Australian National University | 20 | ACT | Australia | Invalid Postalcode |
| Dirty | Espoo | 2600 | ES | Finland | Invalid Postalcode |
| Dirty | Edinburgh X0 Eh3 | 5DA | GA | United Kingdom | Invalid City |
| Dirty | Shchelkovo-4 | 141104 | Russian Federation | Invalid City | |
| Dirty | Azusa | 91702 | CA | Australia | Invalid Postalcode |
| Dirty | London | 11111 | United Kingdom | Invalid Postalcode | |
| Dirty | Boudry | 2017 BOUDRY | NE | Switzerland | Invalid Postalcode |
| Dirty | Dresden | 1069 | Germany | Invalid Postalcode | |
| Dirty | Seattle | 98104 | WA | Italy | Invalid Country/State |
| Dirty | Azusa | 91702 | CA | Australia | Invalid Country/State |
| Dirty | Toronto | M5H 2M8 | ON | United States | Invalid Country/State |
| Status | First Name | Last Name | Outcome | |
| Dirty | Sim0N | Anderson | sim0n.anderson@datatrimtest.com | Invalid Name |
| Dirty | Jan1Ne | Martin | jan1ne.martin@datatrimtest.com | Invalid Name |
| Dirty | Lark0R | Williams | lark0r.williams@datatrimtest.com | Invalid Name |
| Dirty | Taylor | Taylor | taylor.taylor@datatrimtest.com | Invalid Name |
| Dirty | Pierre-Jacques | Anderson | pierre-jacqus.anderson@datatrimtest.com.invalid | Invalid Email |
| Dirty | I’Tidal | Larsson | i’tidal.larsson@datatrimtest.com | Invalid Email |
| Status | Phone | Country | Outcome |
| Dirty | 132 2697 4258 | United Kingdom | Invalid Phone |
| Dirty | +44 207 2356 1233 | United Kingdom | Invalid Phone |
| Dirty | (236) 256 5555 | Norway | Invalid Phone |
| Dirty | +39 (0) 236 256 5555 | Italy | Invalid Phone |
| Dirty | +44 256 2369 1200 | United Kingdom | Invalid Phone |
| Dirty | 132 2697 0592 | United Kingdom | Invalid Phone |
Before you start applying the outcome from the cleaning
During your review you might notice that there are repetitive corrections, and you may notice that the Data Laundry outputs values which you want to be different, e.g. we output United States and United Kingdom as country values, because these are the ISO standards, but you may have a preference for the abbreviated versions US, UK or even GB.
You may adapt the reference data to match your desired output in the setup of the Data Laundry Setup.
Once you are happy with the Preview, you should run the Basket again, but this time in Update Mode, so that your records actually are being updated.
Once done you should already now see an improvement on your overall data quality and in particular your Country and state values:
|
|
It’s Going to Get Worse Before It Gets Better
You may also have notice that your average score has dropped, or at least haven’t increased as much as you hoped for.
This is because the initial assessment is made purely by looking at Completeness, which is just one of multiple measures of Data Quality.
Once the cleaning and validation, the invalid data present in your dataset will impact the Data quality score in a negative direction.
But don’t panic, the outcome of the Data Laundry provides you with details on what is wrong with your data and you can now effectively work your way through the data to improve the data quality in a structured process.
Data Quality Assessment with Data Laundry Output Fields
In addition to the Business-critical fields which are being updated with the cleaned data, the Data Laundry has its own outcome fields which are being populated during the Cleaning (and also if you choose the Validation mode).
The Data Quality Score and Data Quality Indicator are both formula fields, which are being calculated dynamically.
Data Laundry Status
This field has 3 values:
| OK | – The record was processed, but the outcome of the cleaning is identical to the actual values, so no changes has been applied |
| Cleaned | – Fields were cleaned |
| Dirty | – Fields may have been cleaned, but the record is still considered to be Dirty (missing or invalid data) |
Assuming that your database has 1000’s of records, reviewing the data in excel (via the csv file from Preview mode) isn’t practical, thus next time you clean a Laundry Basket in Preview mode, make sure you only select those where the Data Laundry Status = Dirty.
You will get a lot fewer records, and you will easier be able to correct the issues within a smaller set of data.
Data Laundry Outcome
When cleaning or validating your record, the Data Laundry will summarize the issues found in a single string form.

This string will help you run reports to identify records with particular issues, and do your cleaning field by field.
Last Data Laundry Date
Timestamp for the date and time for when this record last was cleaned/validated.
Skip Data Laundry
In some cases, a record should not be passed though the Data Laundry. By checking this checkbox, the records will not be processed, even if it becomes part of a basket selection.
OBS: When you run your reports and clean your Laundry Baskets, you may also consider excluding, contacts which are archived, has opted-out, left the company etc. You can either use the checkbox above, or simply exclude these records via the filter selection.
Eat an Elephant in small bites
The Data Laundry Output Fields are mainly informational, but are intended to be used in segmenting your data into smaller parts which are easier to manage and which will make your Data cleaning more effective.
Examples:
- Basket for Dirty Data. – A Basket, which you can run in iterations for each change you have made to the data or reference data, to clean and validate the changes you have made.
- Basket for New Data. – A Basket which you might want to run on a daily basis, to make sure that data coming into your org. are cleaned, so that e.g. your lead assignment can be done based on standardized values. Select records with Data Laundry Status = None
- Basket for records which has been modified since Last Cleaning. – Why clean everything all the time. Working on deltas, will help you maintain the Last Modified Date as the last date the records was actually modified, not the last time it was cleaned. Select Records with Last Modified Data > Last Data Laundry Date
Improving Data Quality for missing and/or Invalid data
If you have your Data Quality Scores defined according to your business needs and you still have a lot of dirty data to deal with, then you must ask the questions about: Cost of cleaning versus impact on the Data Quality Score.
Collecting invalid and/or missing data, whether it is done through internet search (LinkedIn etc.), enrichment though data sources like data.com, Duns and Bradstreet, call center activities etc., is a costly affair, and you might not want to pass ALL dirty records through this process.
The fewer records you need to process this way the better, so you might at this point start to think about sub-segmenting your data, so that you can focus your effort on the right data.
Within your lists of leads, you might have old and inactive leads, – is this worth spending time on fixing?
Amongst your accounts there may be inactive clients, should they have the same priority as your known and active clients.
Contacts within your client accounts might have moved to new positions internally or moved on to another organization. If the contact was actively involved in the purchase or use of your product/service, then it might be valuable to keep track of this contact in comparison to other contacts which are periphery and with who you have had little or no interactions historically even if they have been in your database for years.
Create Laundry Baskets for each of these segments, and focus on improving the Data Quality on the most important records, and move your way out to the outer circles as you continue down the road on your Data Quality Road Trip.
“Because the greatest part of a road trip isn’t arriving at your destination. It’s all the wild stuff that happens along the way.”
— Emma Chase